Part 2:
This is a continuation from part 1 in the series where I gave a brief overview of our process. Now that we have taken a first pass at process optimization we can begin to automate in earnest. The key is to focus on the data.
Focus on the data:
Data is key to effective laboratory process optimization. Careful record keeping is required to track the impact of myriad different parameters; reagent types, concentrations, volumes, speeds, g-forces, labware types and more. Efficiently tracking these parameters and their outcome can be a difficult task, further confounded by a variety of variables that were not tracked such as time between reagent additions, ambient temperature and humidity, the list goes on. It is difficult and time consuming for scientists to record every detail as they work. Even critical end-point read-outs are often manually transcribed into databases. Scientists read the value from the little computer screen attached to the instrument, and type it into the big computer screen connected to “the database” introducing wasted time and potential error. As a result, data is often lost.
Deploying automation into this workflow often involves spreadsheets with macros, databases, and software. At Leash we’ve chosen to invest in building our own data platform that consists of a central database, an orchestration layer for data-processing, and web-applications for data entry and visualization. By investing our time into building this central data platform we ensure that all of our scientists communicate in the same language about the same data. Information critical at the bench and the console are stored in a common framework. This allows the data we generate to be leveraged for a variety of uses and ensures we have a long-term and relatable dataset for our machine learning models.
The data will allow you to focus:
When you begin to automate a laboratory, things change. Minimally the increase in scale means you will sample from more and more reagents and labware from a variety of vendors. If there is variation in your process or your suppliers’ processes, the scale that automation allows will expose it. Adequate data systems will be critical to understand the root causes of these variations and ensure that new laboratory processes can be quickly reviewed and implemented. Automating your data acquisition early will ensure that you can manage the growing output of data from physical automation that comes later.
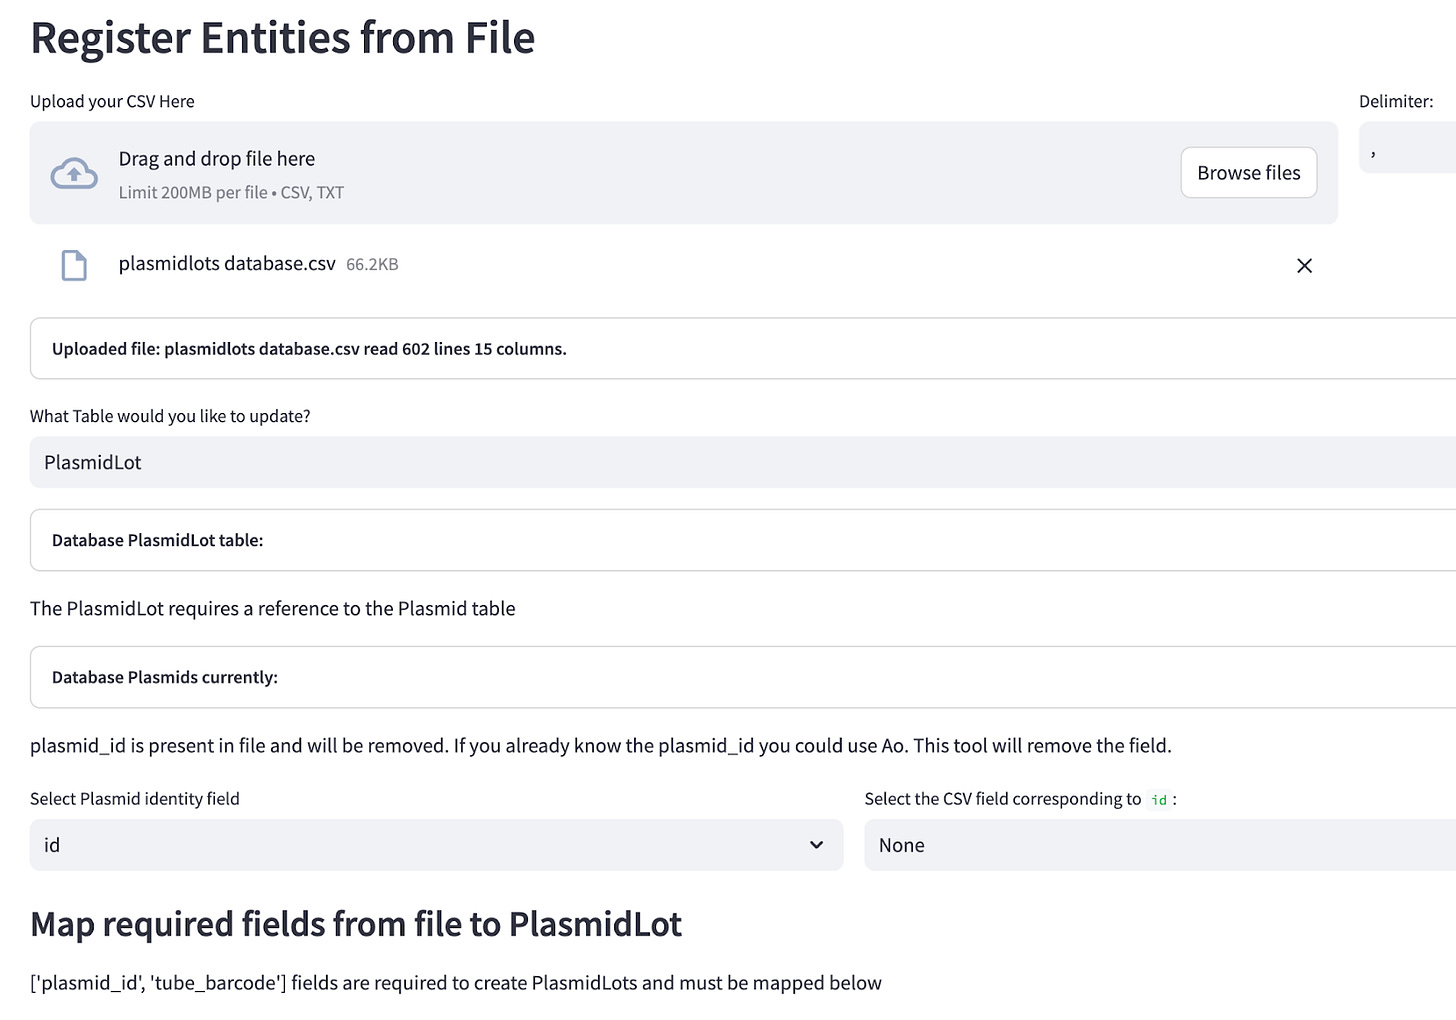
Integrating external registration systems can often require as much or more effort than building your own. A screenshot of our home-built registration system.
First Data Sources:
In the beginning, most data is acquired from vendor data files. When a vendor sends you 384 tiny vials of different, clear, colorless liquids, the CSV file that explains what is in each vial is crucial. Without it the vials are just biohazard waste. Efficiently and accurately capturing the vendor data in a central location is critical. Registering new reagents, and assigning them a unique identifier is the first step to data automation. Receiving data from CRO’s, core facilities and other external laboratories is also critical. This is especially true for DNA sequencing where the instruments can report back a variety of critical quality metrics that can help identify false positives and troubleshoot issues. Capturing these consistently, and accurately associating them with the reagents that were previously registered is critical. Translating and moving data between these systems is often left to humans to do; manually uploading CSV’s, copy-pasting file names etc etc. This type of work is tedious, error prone, and even easier to automate than the physical processes around them. Focusing on this first stage of data automation is key to understanding and controlling the process you want to physically automate. So to summarize, your lab’s input and output data streams are the first to automate.
Our internal web applications track thousands of experiments generating billions of measurements.
Our internal web applications process plate reader XML files to update our database.
Automating Data Acquisition:
Next is internal data acquisition. How are critical observations generated in the lab? Are scientists manually loading a Nanodrop or Qubit one sample at a time? Implementing a microplate reader means that hundreds of measurements can be taken in less than 10 minutes, along with significantly more metadata about those measurements. A good plate reader like our Tecan M200 will output an XML file that records every parameter used to acquire the data along with exactly when and where the data was acquired. The time and error introduced by physically loading each of hundreds of samples is significant, but the time and error introduced by squinting at each readout one at a time and typing the value into a spreadsheet with gloved hands is also significant. Automating internal data acquisition is key to freeing up scientist time and improving the available data to allow for process optimization and troubleshooting.
Reviewing and defining quality metrics at Leash.
Stay tuned for part 3 Automating Data Analysis and the Scientific Method


"Are scientists manually loading a Nanodrop or Qubit one sample at a time? Implementing a microplate reader means that hundreds of measurements can be taken in less than 10 minutes, along with significantly more metadata about those measurements. "
saves tons of time!